How to convert CSV to a flowchart without Visio
Rebuild a Data Visualizer process map straight from the CSV your system exports: which Visio column becomes which spreadsheet column, why the wizard never took a .csv, and how to renumber Next Step ID.
A Data Visualizer table is just rows, and the rows are usually a .csv before Excel ever sees them, so the conversion is a header rename, a renumbering of Next Step ID into row positions, and a check on the delimiter, quoting and encoding of the file.
The short version
- The .csv-to-.xlsx round trip disappears: drop the exported file on the spreadsheet area, or paste the text into it.
- Headers are the mapping: Process Step Description to Box text, Next Step ID to Line to, Connector Label to Line text, Shape Type to Shape.
- Function becomes the Vertical lane column and Phase the Horizontal lane column; each distinct value is one lane.
- The comma branch convention is identical: "6,4" in Line to with "Matches,Price or quantity differs" in Line text, paired by position.
- The only real conversion is numbering: Line to holds row positions, not Process Step IDs.
What the export keeps when the add-in goes away
The Visio Data Visualizer add-in for Excel was announced for retirement on the Microsoft 365 Blog in November 2025, with a service shutdown date of 2 March 2026 that Microsoft reaffirmed in December 2025 as unchanged. The retirement notice sets that shutdown date; older add-in support articles still use future-tense wording. What was announced is also narrower than people assume: the add-in, not the Data Visualizer templates in the Visio desktop app, which carry no retirement notice and are documented as Visio Plan 2 only. /guides/visio-data-visualizer-alternatives sets that split out in full. This page handles the practical half: you are holding a table, and you want the diagram back.
In most cases that table did not begin life in Excel. It came out of an ERP, a service desk, a workflow tool or a database query, and it arrived as a .csv that somebody opened and formatted as a table because the wizard insisted. Visio's Create Diagram from Data wizard asks for a workbook and then for a table or a named range inside it; a .csv is neither, and renaming the extension does not change that. So the first thing the move buys you is the deletion of a step: no .csv-to-.xlsx round trip before a diagram can exist. QueryChart's editor is a spreadsheet, and the file goes onto it directly: drop the .csv on the spreadsheet area, or paste the CSV text into it. There is no import wizard and no column-mapper screen, because the header row is the mapping.
The columns line up almost one to one. Process Step Description becomes Box text, Next Step ID becomes Line to, Connector Label becomes Line text, Shape Type becomes Shape, Function becomes the Vertical lane column and Phase becomes the Horizontal lane column. Matching is on header name rather than column position, so whatever order the export wrote is irrelevant, and headers nothing recognises (Process Step ID, Alt Description, cycle times, system names) are carried in the file and ignored. Exactly one thing genuinely converts rather than copies: Next Step ID names an ID, while Line to takes a row's 1-based position, so IDs that do not already run 1, 2, 3 have to be renumbered.
Everything else is the tax a plain-text format charges. The delimiter your system chose, the encoding it wrote, and the quoting around fields that contain commas of their own: a branch cell reading 6,4 survives a comma-delimited file only inside double quotes, and that one detail wrecks more conversions than any question of process logic. /guides/how-to-structure-csv-for-flowcharts is the file-shape reference for it. The example below is an order-to-delivery map exported from an ERP (the chart behind /templates/csv-process-map) rebuilt in four stages, in the order the columns should land. Nothing is lost in the move: everything the add-in drew was derived from those columns, so a table that produced a correct diagram in Visio produces the same diagram here.
A Data Visualizer table rebuilt from its CSV
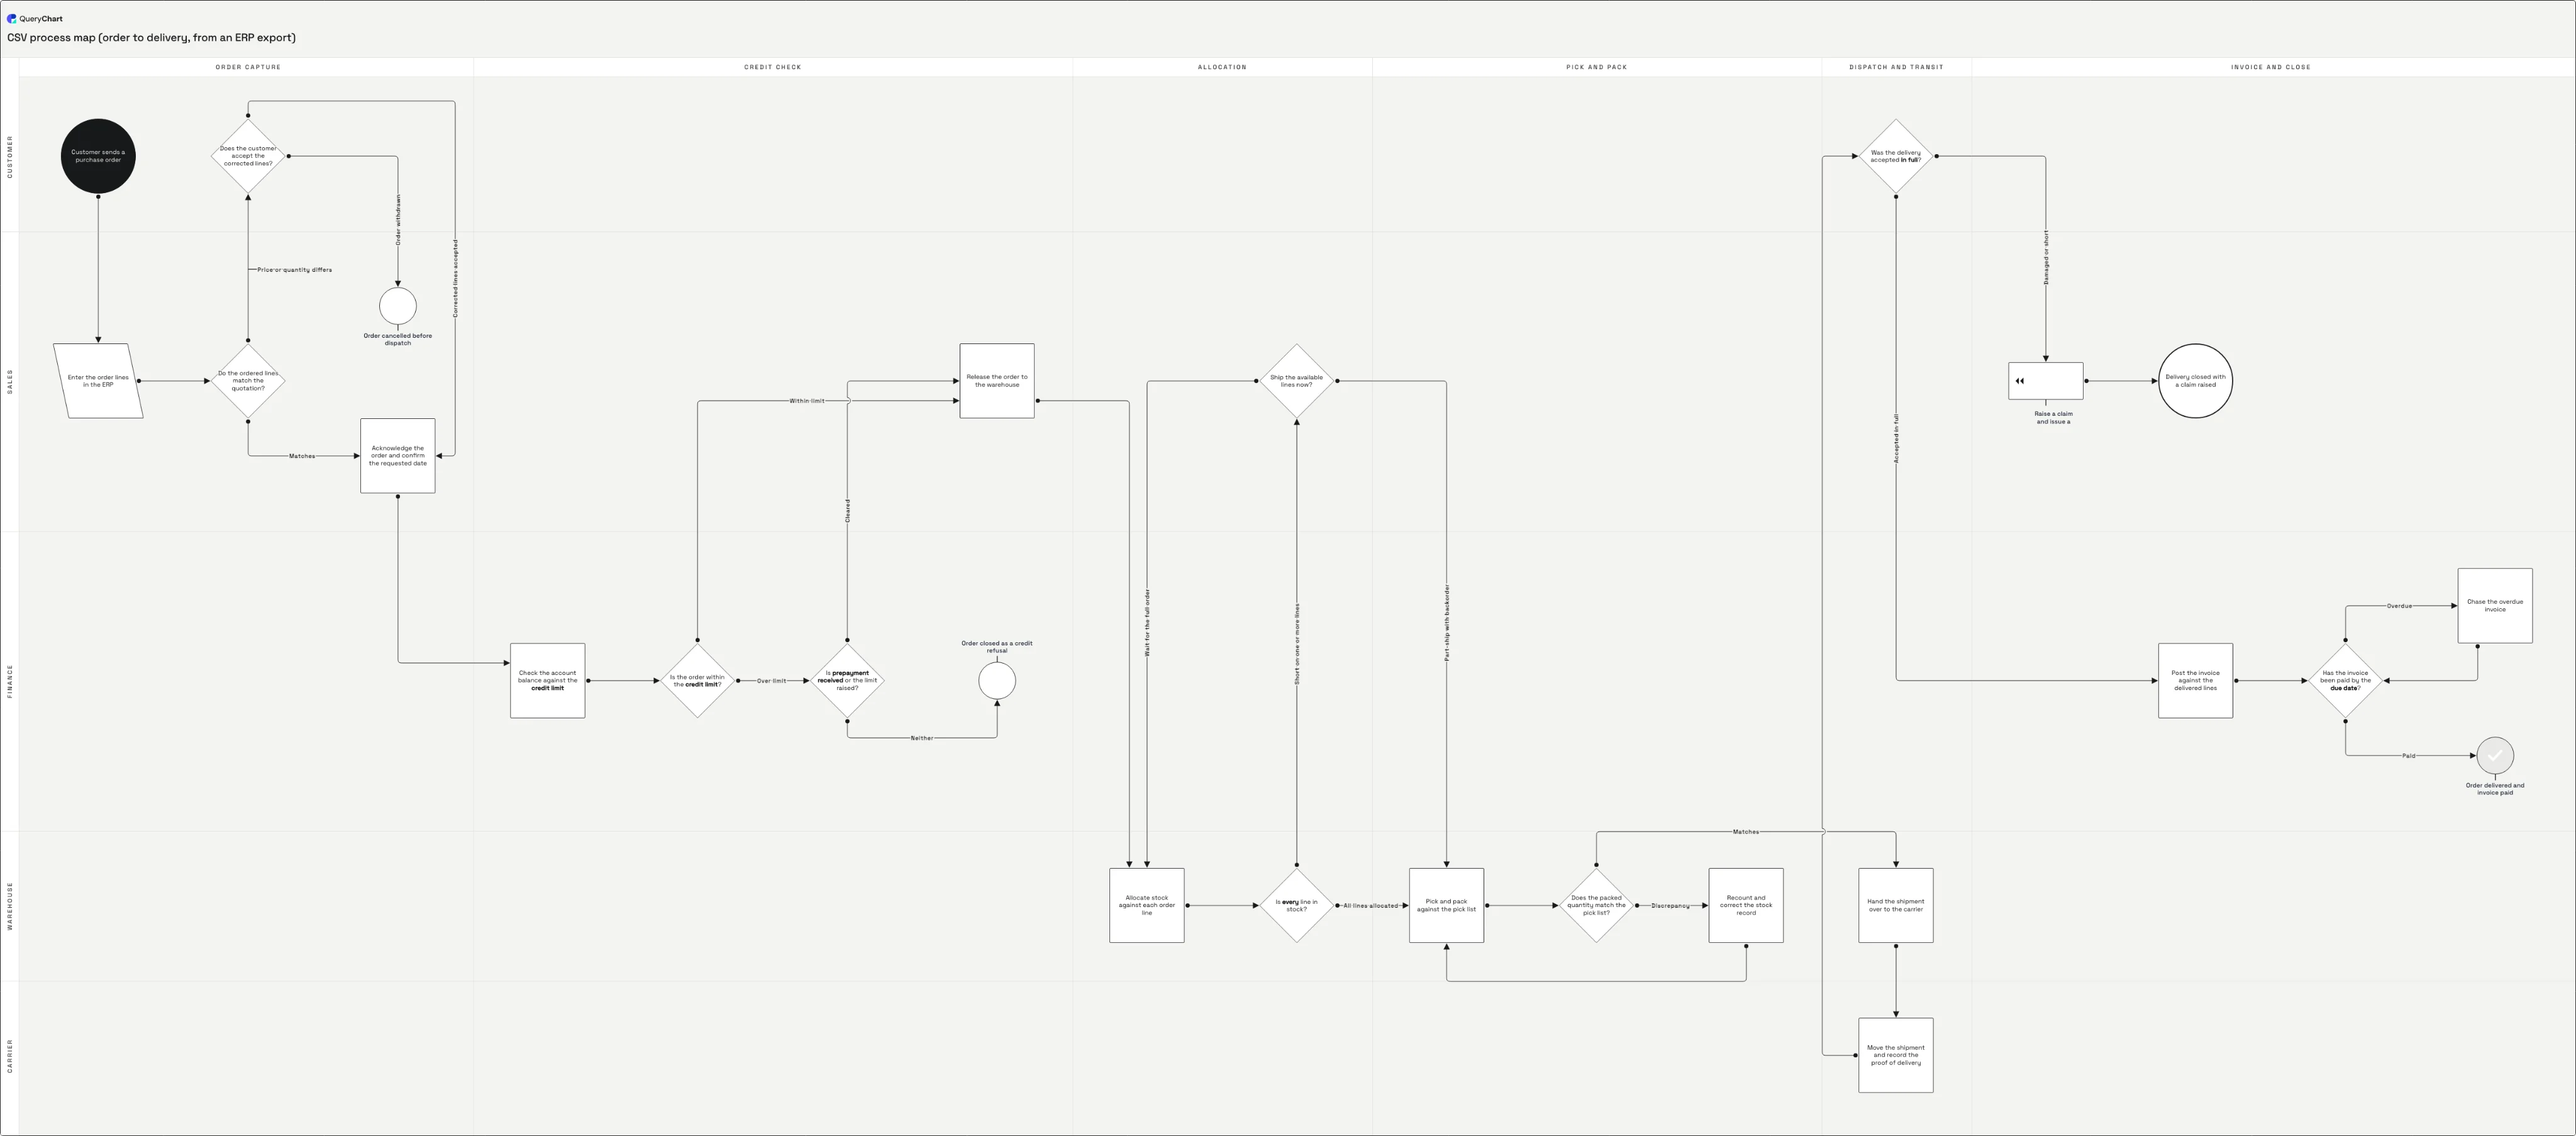
An order-to-delivery process exported from an ERP, landing one group of columns at a time. Open the spreadsheet panel to read the columns alongside the canvas.
Descriptions and shapes
Six rows in, with Box text and Shape Type mapped across and nothing else. "Customer sends a purchase order" is the Start, "Do the ordered lines match the quotation?" is already a diamond, and "Order cancelled before dispatch" is a Reject rather than an arrow into empty space. Data Visualizer's Start, Process, Decision and End land as they are written; Subprocess maps to Process.
Next Step ID renumbered into Line to
The connections arrive once the IDs have been rewritten as row positions. Row 8, "Is the order within the credit limit?", forks to 11 and 9, and row 14, "Ship the available lines now?", points back at row 12 to wait for the full order. A backward edge is only a smaller number in the cell, which is why loops survive a CSV export intact while they never survive a redraw.
Connector Label into Line text
The branch labels fill in and the pairing convention is the one you already used: row 3 carries "Matches,Price or quantity differs" against "6,4", and row 20, "Was the delivery accepted in full?", carries "Accepted in full,Damaged or short". Position is what binds a label to a destination, in the CSV exactly as in the add-in, so a reordered pair is wrong without being visibly wrong.
Function and Phase become the lanes
The last two columns land: Customer, Sales, Warehouse, Finance and Carrier from Function into Vertical lane, and Order capture, Credit check, Allocation, Pick and pack, Dispatch and transit and Invoice and close from Phase into Horizontal lane. Twenty-six rows, five roles, six phases, and no shape dragged anywhere. The credit refusal ending in Finance and the claim ending in Sales are now visibly two different failures owned by two different teams.
How it works
Export the table as CSV, not the diagram
The picture the add-in rendered is not the asset; the table underneath it is. Export that table to .csv, from the workbook that fed the add-in, or straight from the system the workbook was itself copied out of, which is usually the better source because it has not been reformatted by hand. Check three things while you are there: one header row, one row per step, and no merged cells anywhere in the range.
Read the first line of the file in a plain text editor
Before anything is pasted, open the .csv as text and look at the header line. You are checking which character separates the fields, whether values are wrapped in double quotes, and whether accented or non-Latin labels have survived the encoding. Exports from a European locale are frequently semicolon-delimited, because the comma is the decimal separator there, and that has consequences for the branch columns two steps from now.
Rename the headers to the editor's column names
Matching is by header name, not position, so the whole mapping is one edit to the first line: Process Step Description to Box text, Next Step ID to Line to, Connector Label to Line text, Shape Type to Shape, Function to Vertical lane, Phase to Horizontal lane. Leave the rest of the columns exactly where they are. Process Step ID, Alt Description and anything else the export emitted are carried in the file and ignored, which means you do not have to prune a wide export before it will load.
Renumber the connections to row positions
Line to addresses rows by their 1-based position, while Next Step ID addressed steps by an ID that was often 10, 20, 30 or a system key. Fix the row order first and treat it as final, then build a lookup from ID to position and rewrite every Next Step ID value through it, including each element inside a comma-separated pair. IDs that already run 1, 2, 3 in order need nothing. Everything else needs this, and skipping it produces a chart whose arrows are confidently wrong rather than obviously broken.
Quote the fields that contain commas
A Line to value of "6,4" and a Line text value of "Matches,Price or quantity differs" both contain the delimiter of a comma-delimited file. They must sit inside double quotes or the row silently gains extra columns and loses its branches. Excel writes those quotes when you use Save As CSV UTF-8; a file assembled by a report writer or a shell script often does not. If the export is semicolon-delimited instead, the commas inside those fields are ordinary data and need no quoting, which is exactly why you looked at the first line before touching anything.
Drop the file on the spreadsheet and fix what it exposes
Open a new chart, drop the .csv onto the spreadsheet area or paste the text in, and the diagram renders from the rows. Then read it for the two faults a table hides and a canvas cannot: a step with no successor, and a decision with one exit. Correct those in the rows, and if the map is going to be relied on by anyone else, put it through review so the approved revision is the one people open.
Mistakes to avoid
Pasting Next Step ID through unchanged
It is the one column that cannot be copied verbatim. A Next Step ID of 40 in a 26-row file addresses no row at all, and a set of IDs running 10, 20, 30 quietly addresses the wrong rows instead: every arrow lands somewhere plausible and nothing looks broken. Renumber before you import, not after.
Blanket-replacing semicolons with commas
The standard fix for a semicolon-delimited export destroys the branch columns, because Line to and Line text legitimately contain commas inside a single field. Re-export with a comma delimiter and proper quoting, or convert with a tool that understands quoting. A find-and-replace across the whole file is the version that appears to work until you count the arrows.
Sorting the rows after renumbering
Once Line to holds row positions, the row order is the identity of every step. Sorting the CSV by owner or by phase to make it tidier rewires the entire chart in one action, and the diagram it produces is coherent enough that nobody notices. Sort first, renumber second, then leave the order alone.
Assuming all of Data Visualizer was retired
The announcement covers the add-in for Excel. The Data Visualizer templates in the Visio desktop app carry no retirement notice, and Microsoft's own recommended replacement is Visio Plan 2 with that desktop app: US$15 per user per month list price paid yearly at the time of writing. If you are on Plan 2 and on Windows, that is the path of least resistance and you should take it. There is no Visio desktop app for macOS, and Visio for the web refuses to edit data-connected diagrams, so on a Mac that route does not exist.
Rebuild your Data Visualizer table
Open the order-to-delivery example to see the mapped columns, then drop your own exported .csv over them.
Related guides
Frequently asked questions
Is the Visio Data Visualizer add-in actually gone?
It was announced for retirement on the Microsoft 365 Blog in November 2025, with a service shutdown date of 2 March 2026 that Microsoft reaffirmed in December 2025 as unchanged. Older add-in support articles remain live and use future-tense wording, but Microsoft’s retirement notice sets March 2, 2026 as the service shutdown date. Do not build a new workflow around the retired add-in. The Data Visualizer templates inside the Visio desktop app are a separate feature, are not covered by that announcement, and are documented as Visio Plan 2 only.
Why would Visio never take my .csv directly?
The Create Diagram from Data wizard asks for an Excel workbook and then for a table or custom range inside it. A .csv is neither, and renaming the extension does not make it one, so the documented answer was always to save as .xlsx first. The exception people remember and then over-generalise is the Organization Chart Wizard, which does read comma- and tab-delimited .txt files, but it builds org charts, not process flows, and /guides/how-to-create-an-organizational-chart-from-csv covers that shape of data separately.
Does the comma-separated branch syntax carry over?
Almost verbatim. A Connector Label of "Yes,No" is a valid Line text value as it stands, and the labels are matched to destinations by position in both tools, so nothing about the convention has to be relearned. The only part that changes is what the destinations are: Next Step ID held step IDs and Line to holds 1-based row positions. Convert the numbers, keep the commas, keep the order.
What happens to my Function and Phase columns?
Function goes into the Vertical lane column and Phase into the Horizontal lane column, and each distinct value becomes a lane with steps placed automatically: the same behaviour the cross-functional Data Visualizer template gave you. Worth knowing: the basic Data Visualizer template read a table's function and phase columns not at all, so if your source has them populated but your old diagram was flat, you are about to get swimlanes you already had the data for.
Can I get a .vsdx file back out?
No. Exports are PNG, SVG and PDF, and there is no .vsdx writer, so if a downstream system consumes Visio files (a SharePoint pipeline, Power BI shape data, a document set that expects .vsdx), that requirement points back at Visio Plan 2 and this is not the tool for it. For maps that end up in documents, decks, wikis and audits, the image and PDF formats cover it, and the chart itself stays live and editable as rows.