Sankey Diagram vs Waterfall Chart: Which to Use
A waterfall chart steps from a start value to an end value through additions and subtractions; a Sankey shows where each part went. Compare them and pick the right one.
A waterfall chart is a bridge from one number to another: start, add, subtract, end. A Sankey shows the same movements as parts of a whole, branching as they go.
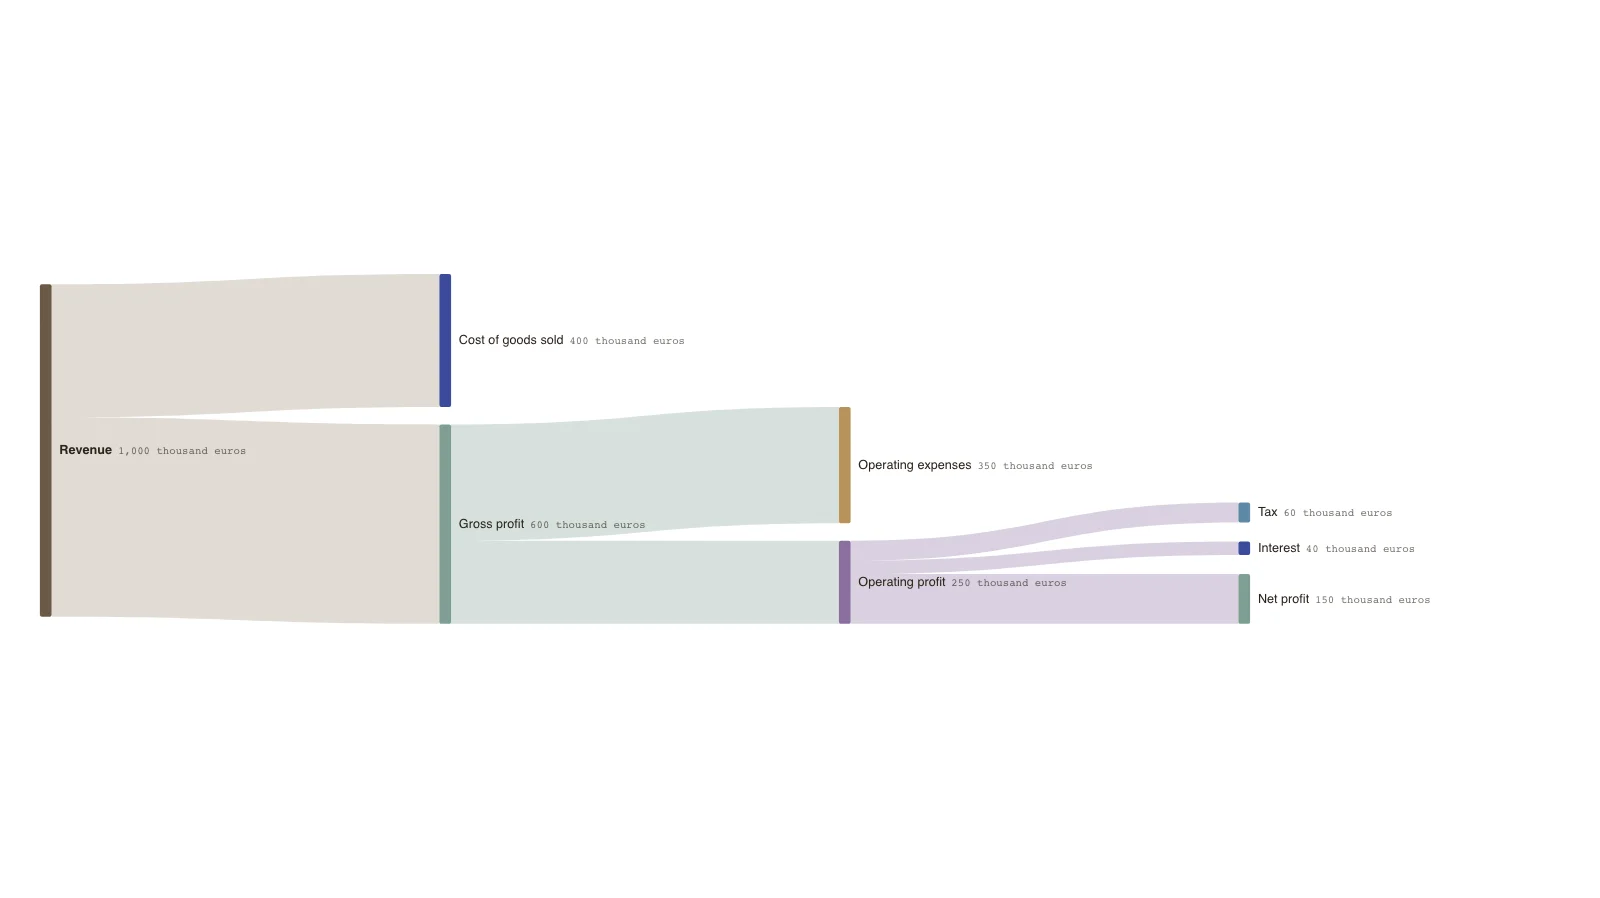
The example takes revenue of 1,000 thousand euros to a net profit of 150: cost of goods, operating expenses, tax and interest are the steps. A waterfall shows these as a staircase. A Sankey shows each as a branch leaving the main stream.
The waterfall is better when the order of steps and the running subtotal matter. The Sankey is better when the parts are alternatives or can themselves divide.
A bridge or a branch
A waterfall reads left to right as a running total. Each bar floats from the previous total. A Sankey reads as a stream that loses parts, with the remaining stream continuing to the right.
When each works
Waterfalls suit one sequence of changes between two totals, such as a profit bridge between years. Sankeys suit changes that branch.
- Waterfall: a running total, step by step.
- Sankey: shares of a stream, branching.
- Waterfall: positive and negative steps.
- Sankey: amounts are all positive; the sign is the direction.
Choosing
Use a waterfall for a bridge between two values. Use a Sankey to show where a total went and how each part divides.
Key points
- Revenue of 1,000 turns into 150 of net profit, a 15% margin in this example.
- Costs of goods and operating expenses together take 750.
- Gross profit is 600; operating profit 250; tax and interest take 100 together.
- The figures are invented.
The example’s data
Invented figures, balanced at every node.
| From | To | Amount (thousand euros) |
|---|---|---|
| Revenue | Cost of goods sold | 400 |
| Revenue | Gross profit | 600 |
| Gross profit | Operating expenses | 350 |
| Gross profit | Operating profit | 250 |
| Operating profit | Tax | 60 |
| Operating profit | Interest | 40 |
| Operating profit | Net profit | 150 |
The same data as CSV
source,target,value
Revenue,Cost of goods sold,400
Revenue,Gross profit,600
Gross profit,Operating expenses,350
Gross profit,Operating profit,250
Operating profit,Tax,60
Operating profit,Interest,40
Operating profit,Net profit,150
How it works
List the steps from start to end
Each with its amount.
Decide if parts only subtract
If they only subtract, the Sankey is simple. Positive and negative steps suit a waterfall better.
Enter the flows
Each subtotal sends its cost to a branch and the remainder onwards.
Check the balance
Revenue should equal costs plus profit at each step.
Frequently asked questions
Can a Sankey show a negative step?
Not directly. Amounts must be positive, so a step that adds is a new source and a step that subtracts is a branch.
Which suits a finance audience?
Finance readers often expect a waterfall for a bridge. Use the Sankey when the question is where the total went.
Edit this profit Sankey
Open the example as your own chart and enter your revenue and costs.