Sankey Diagram vs Pie Chart: Which to Use
A pie chart shows one total divided into parts; a Sankey shows how that total is divided at several levels and where each part goes. Compare them and choose the right one.
A pie chart answers one question: what share of the total is each part. A Sankey answers that and also shows how the parts divide again at the next level.
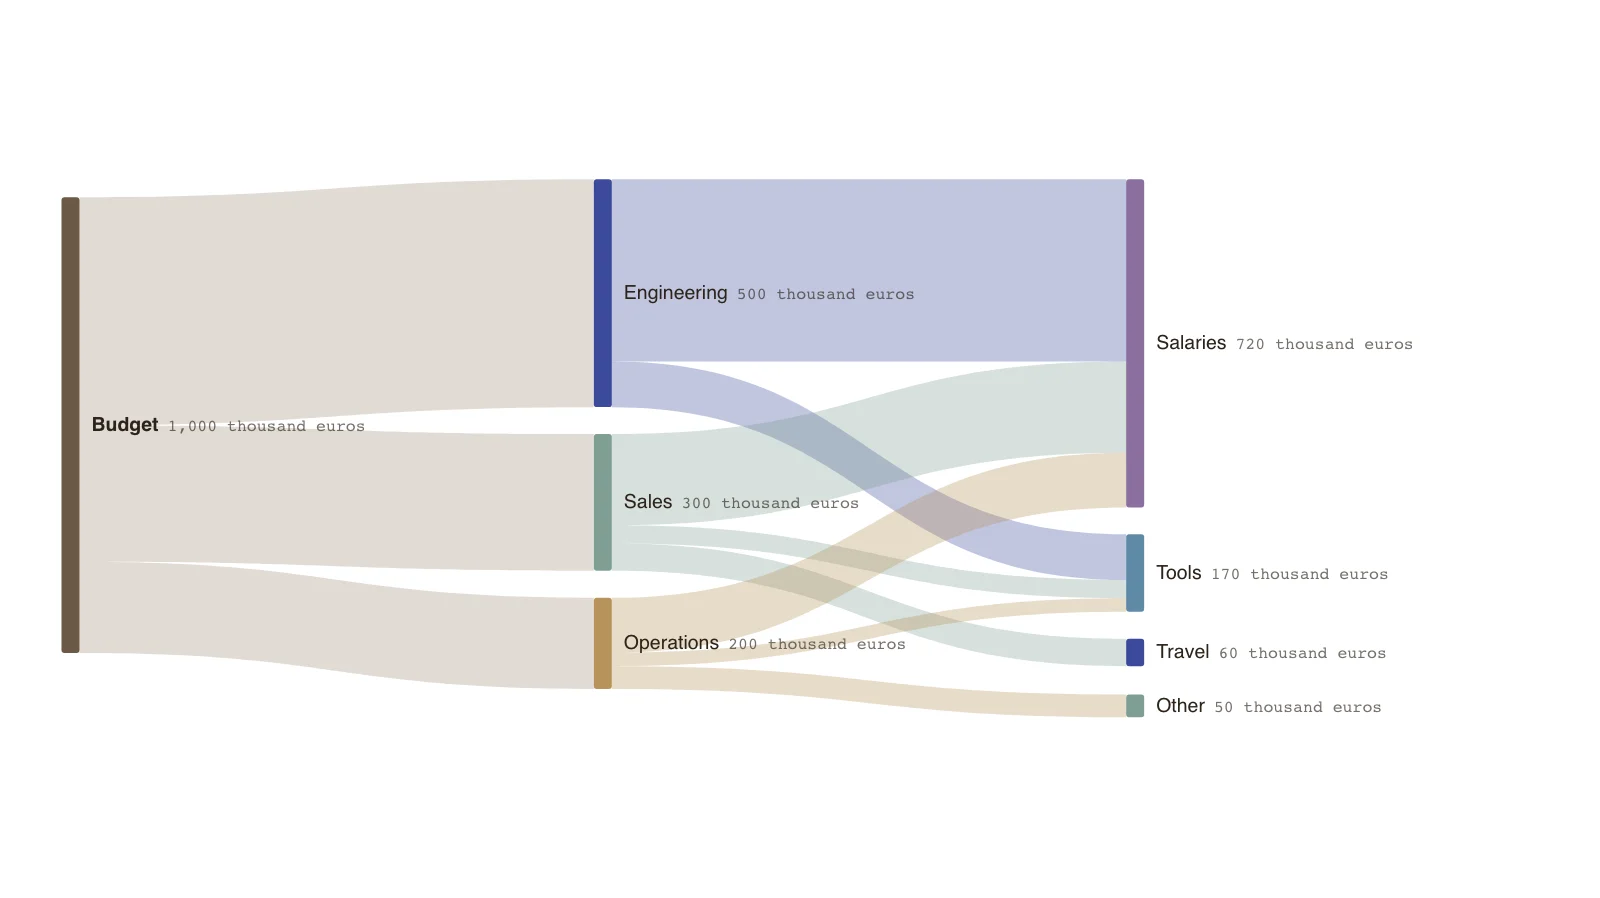
The example is a budget of 1,000 thousand euros split by department and then by type of spend. A pie could show either split, but not both, and not which department drives which cost.
Use a pie for a single split with few parts. Use a Sankey when the same total divides twice or more.
What a pie does well
A pie shows how one total divides into a handful of parts. It reads quickly when there are three to five parts and the differences are large.
- One level of division only.
- Angles and areas are hard to compare when parts are close.
- Labels and a legend compete for attention.
What a Sankey adds
A Sankey keeps the parts and shows how each divides again. The same category, such as Salaries, can receive from several parents, and its total is the sum of them.
- Several levels in one picture.
- A category fed by several parents shows each contribution.
- Widths are comparable along a shared scale.
Choosing
If the audience needs only the split of one total, use a pie or, better, a sorted bar chart. If they need to see how a split breaks down further, use a Sankey.
Key points
- Engineering is half of the 1,000 thousand euros budget.
- Salaries total 720 across three departments (400 + 200 + 120), which a pie of departments would not show.
- Tools are 170, travel 60 and other 50.
- The figures are invented.
The example’s data
Invented budget, balanced at every node.
| From | To | Amount (thousand euros) |
|---|---|---|
| Budget | Engineering | 500 |
| Budget | Sales | 300 |
| Budget | Operations | 200 |
| Engineering | Salaries | 400 |
| Engineering | Tools | 100 |
| Sales | Salaries | 200 |
| Sales | Travel | 60 |
| Sales | Tools | 40 |
| Operations | Salaries | 120 |
| Operations | Tools | 30 |
| Operations | Other | 50 |
The same data as CSV
source,target,value
Budget,Engineering,500
Budget,Sales,300
Budget,Operations,200
Engineering,Salaries,400
Engineering,Tools,100
Sales,Salaries,200
Sales,Travel,60
Sales,Tools,40
Operations,Salaries,120
Operations,Tools,30
Operations,Other,50
How it works
Count the levels
One level of division suits a pie; two or more suits a Sankey.
List the totals at each level
Department totals, then spend type within each.
Enter the flows
Each parent sends its total to its children.
Check the balance
Every department should pass on exactly what it received.
Frequently asked questions
Is a pie chart ever better?
Yes, for a single split with few parts when the audience wants a quick sense of proportion.
Can I use both?
Yes. A pie in a summary and a Sankey in the analysis page is a common pairing.
Edit this budget Sankey
Open the example as your own chart and enter your budget.