Sankey Diagram vs Funnel Chart: Which to Use
A funnel chart shows how a total shrinks stage by stage; a Sankey also shows where each drop-off went and lets stages branch. Compare them and pick the one that answers your question.
A funnel chart is the right answer when the question is how many make it from one stage to the next. A Sankey is the right answer when the question is where the others went.
Both start from the same numbers. The funnel draws one bar per stage and shows the shrinking. The Sankey draws the same stages and also gives each exit its own ribbon, so a visitor who leaves is a visible quantity, not an empty space.
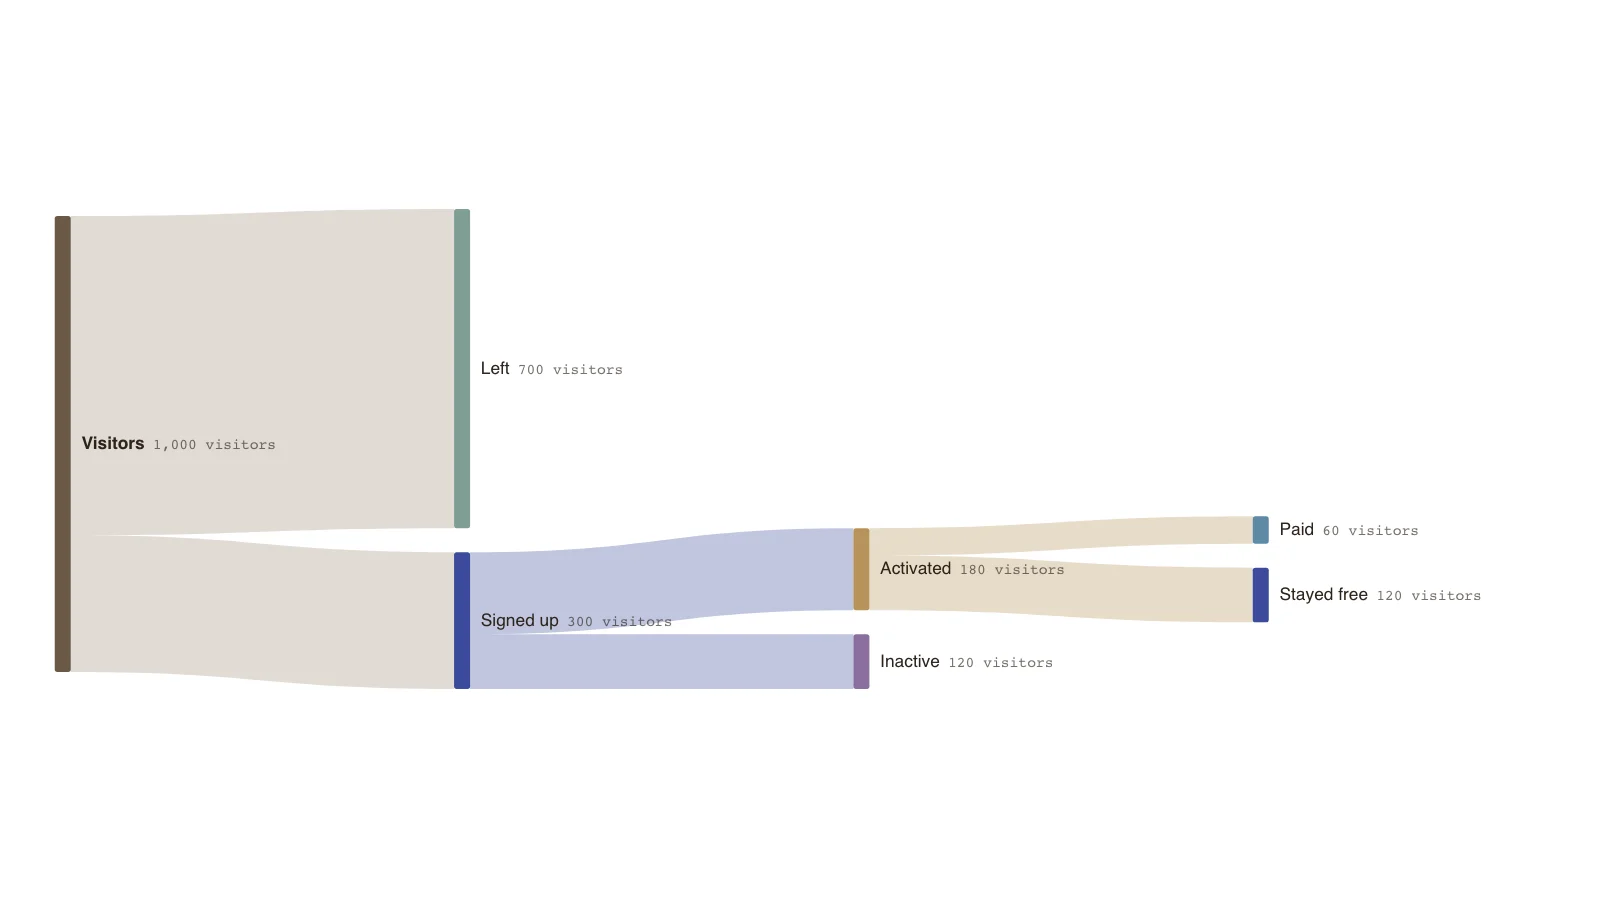
The example is a small signup funnel drawn as a Sankey: 1,000 visitors, 300 sign up, 180 activate and 60 pay. The drop-offs are as wide as the survivors.
The difference
A funnel is a sequence of stage totals. A Sankey is a set of flows between nodes, which can include several exits and more than one path.
- Funnel: one bar per stage, strictly sequential.
- Sankey: ribbons between stages, with branches and exits.
- Funnel: easy to compare stage-to-stage conversion.
- Sankey: shows where people went and which segments differ.
A selection guide
Need exact comparison of categories? Use a bar chart. Need part-to-whole? Use a pie or stacked bar. Need sequential conversion through fixed stages? Use a funnel. Need branching quantities, with exits and alternative paths? Use a Sankey. Need the logic of a process? Use a flowchart.
Using them together
A funnel works well in a summary slide, and a Sankey in the analysis that explains the biggest drop.
Key points
- 1,000 visitors become 60 paying customers: 6% overall.
- 30% of visitors sign up; 60% of signups activate; one third of activated users pay.
- The 700 who leave are the widest ribbon, something a funnel would show only as the gap between bars.
- The figures are invented.
The example’s data
Invented counts for one cohort, balanced at every node.
| From | To | Amount (visitors) |
|---|---|---|
| Visitors | Signed up | 300 |
| Visitors | Left | 700 |
| Signed up | Activated | 180 |
| Signed up | Inactive | 120 |
| Activated | Paid | 60 |
| Activated | Stayed free | 120 |
The same data as CSV
source,target,value
Visitors,Signed up,300
Visitors,Left,700
Signed up,Activated,180
Signed up,Inactive,120
Activated,Paid,60
Activated,Stayed free,120
How it works
State the question
Decide whether you need to compare stages or to see where people went.
Start with stage totals
List the stage counts, which you need for either chart.
Add the exits
If exits matter, give each its own node and use a Sankey.
Check the balance
Each stage should send on exactly what it received, exits included.
Frequently asked questions
Can a Sankey replace a funnel chart?
For analysis, often yes. For a quick headline of stage conversion a funnel is simpler and easier to read at a glance.
Is a Sankey harder to read?
A little. It carries more information, so it rewards a short caption pointing out the main finding.
Edit this funnel Sankey
Open the example as your own chart and enter your stage counts.