Multi-Stage Sankey Chart: How to Build One With Four Levels
Chain several stages into one Sankey, from order channel to warehouse to carrier to delivery outcome. Learn how to structure multi-level flows and keep them balanced.
A multi-stage Sankey follows a quantity through more than two steps. Each stage is a column, and each column's total equals the total of the one before it.
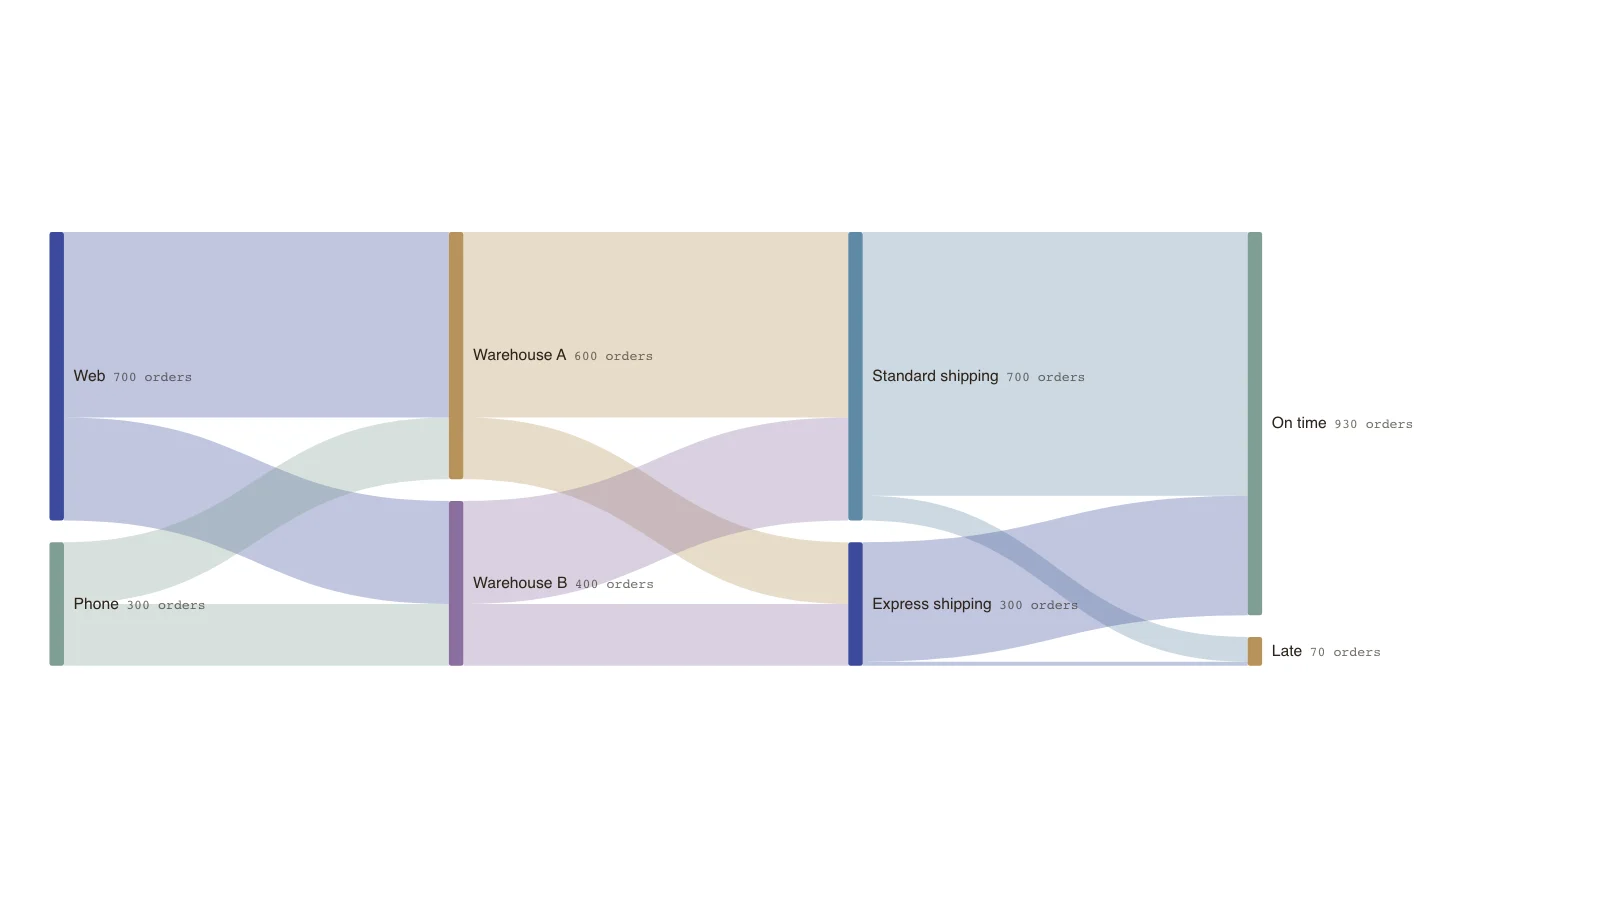
The example follows a thousand orders through four stages: the channel they came in on, the warehouse that fills them, the carrier service used, and whether delivery was on time. Reading left to right you can ask a question that a two-level chart cannot, such as whether express shipping from one warehouse is late more often.
The structure is simple: every stage is a set of nodes, and flows connect nodes in neighbouring stages. A multi-stage chart is just a table with more rows.
Define the stages first
Write the stages as a list, one per column, before you collect data. Each stage should be a different kind of category, not a repeat of the previous one.
Every stage must add up to the same total
If 1,000 orders enter, 1,000 must be in the warehouse stage, in the carrier stage and in the outcome stage. A stage with a different total has a missing or extra flow.
Handling flows that skip a stage
If some orders do not go through every stage, add a flow that connects the earlier and later nodes directly, or add an explicit Not applicable node to the skipped stage.
Reading across stages
Follow a ribbon from left to right to see a path. In the example, the widest path is web, warehouse A, standard shipping, on time.
Key points
- 1,000 orders pass through four stages; 930 (93%) are delivered on time.
- Warehouse A fills 600 orders and warehouse B 400.
- Express shipping is late for 10 of 300 orders (3%), standard for 60 of 700 (9%).
- The figures are invented.
The example’s data
Invented order counts, balanced at every node and every stage.
| From | To | Amount (orders) |
|---|---|---|
| Web | Warehouse A | 450 |
| Web | Warehouse B | 250 |
| Phone | Warehouse A | 150 |
| Phone | Warehouse B | 150 |
| Warehouse A | Standard shipping | 450 |
| Warehouse A | Express shipping | 150 |
| Warehouse B | Standard shipping | 250 |
| Warehouse B | Express shipping | 150 |
| Standard shipping | On time | 640 |
| Standard shipping | Late | 60 |
| Express shipping | On time | 290 |
| Express shipping | Late | 10 |
The same data as CSV
source,target,value
Web,Warehouse A,450
Web,Warehouse B,250
Phone,Warehouse A,150
Phone,Warehouse B,150
Warehouse A,Standard shipping,450
Warehouse A,Express shipping,150
Warehouse B,Standard shipping,250
Warehouse B,Express shipping,150
Standard shipping,On time,640
Standard shipping,Late,60
Express shipping,On time,290
Express shipping,Late,10
How it works
List the stages
Name each stage and the categories inside it.
Count between neighbouring stages
Count orders that go from each category to each category in the next stage.
Enter the flows
Type every flow in the sheet, one row per source node.
Check each stage
Confirm that the totals match from stage to stage.
Frequently asked questions
How many stages can I have?
Four to five stay readable. Beyond that, consider splitting the chart in two.
Can flows go back to an earlier stage?
A flow that returns to an earlier stage is treated as a loop and drawn separately. Avoid loops unless the loop is the point.
Edit this multi-stage Sankey
Open the example as your own chart and add your own stages.