How to create an organizational chart from CSV
How to turn an HRIS CSV export into a chart of the reporting line: resolve employee_id and manager_id to row numbers, invert the direction the manager column points, and handle orphans and cycles.
An HRIS export stores the hierarchy as a pointer (each row names its manager and nothing names its reports), so converting it into a chart is a lookup from identifiers to row numbers plus a reversal of direction.
The short version
- employee_id and manager_id are identifiers; Line to takes 1-based row numbers. Converting is a lookup.
- manager_id points up the tree, Line to points down the flow: invert it or every arrow runs backwards.
- A manager_id with no matching employee_id means the export was filtered, not that the person has no boss.
- Two rows naming each other is a cycle: the walk up never terminates. Find it in the file, not on the canvas.
- Depth in the reporting line maps onto the Horizontal lane column, so each level of authority gets its own lane.
What a manager_id column actually gives you
An HRIS export is a plain text file with one row per person: employee_id, manager_id, a name, a job title, a cost centre, and usually a column or two describing what that person is allowed to approve. The hierarchy is in there, but it is stored as a pointer. Each row names its manager and no row names its reports, which is the correct way to keep a tree in a table and the reason the file does not become a chart by being pasted.
There are two different diagrams people mean by "org chart from CSV". One is the tree: a box per person, managers above their reports, read to answer who reports to whom. QueryChart has a dedicated org-chart editor for that shape and it is the better tool for it. The other is the reporting line as a route (the path a request takes as it climbs from the person who raised it to the person allowed to sign it), and that is a flowchart, which is what this page is about.
Converting is two operations on the export. The first is a lookup: the Line to column takes 1-based row numbers, not identifiers, so E1042 sitting in a cell connects nothing. The second is a reversal: manager_id points up the tree, from a child to its parent, while Line to points down the flow, from a row to the rows it leads to. Getting the file into a shape that survives the paste is covered in /guides/how-to-structure-csv-for-flowcharts, and the plain parent-child version of the same data is at /templates/csv-parent-child-hierarchy.
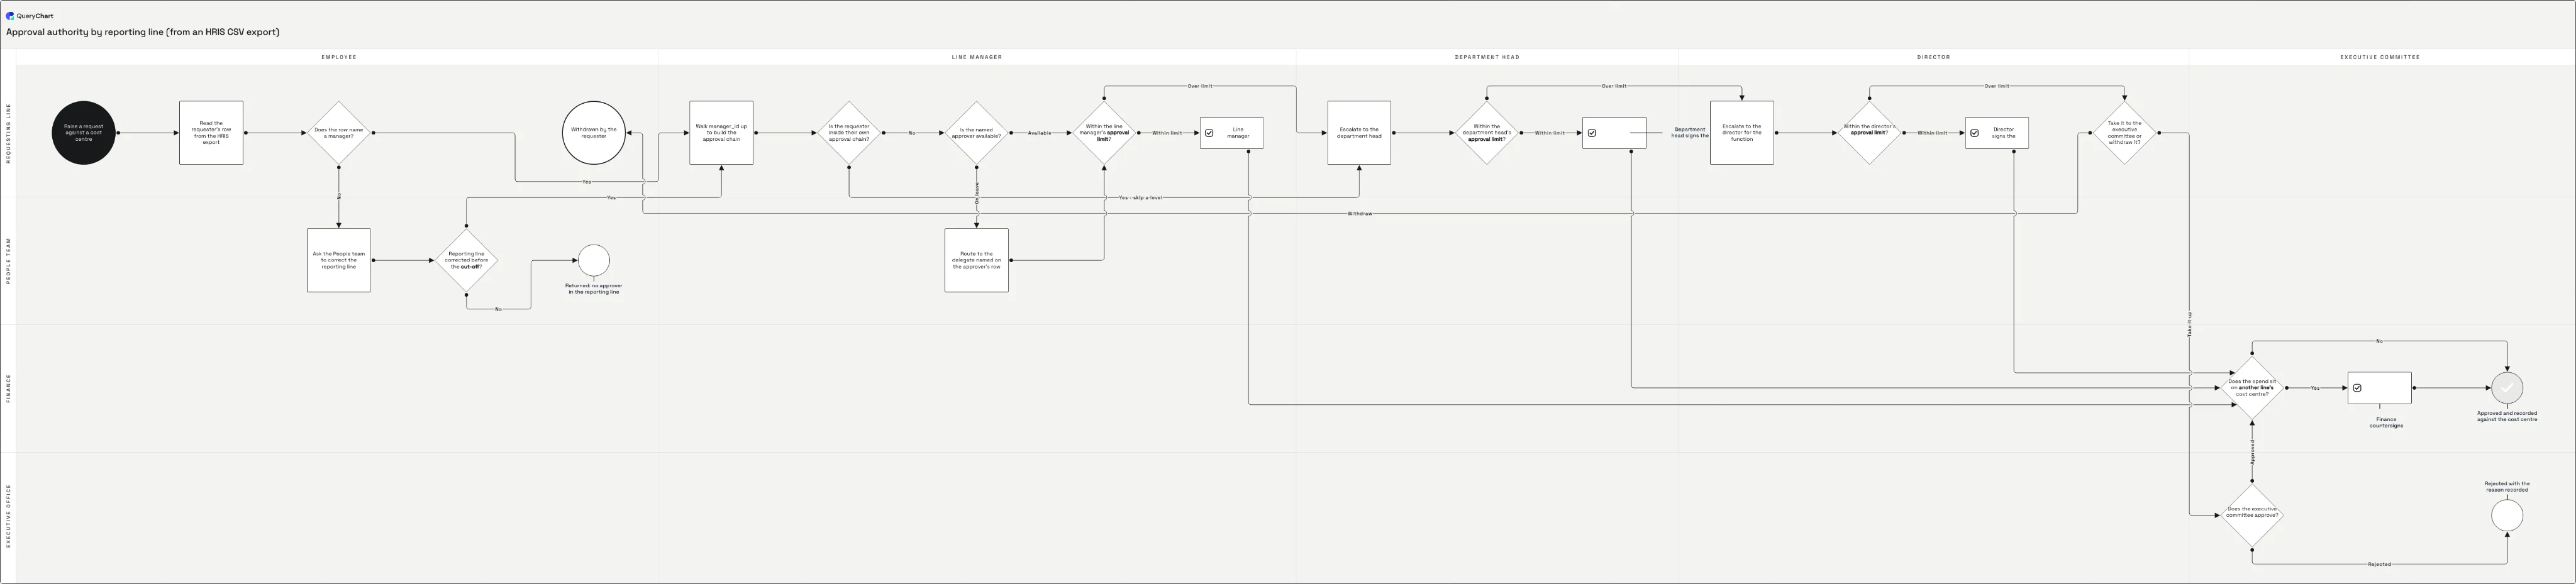
The example below is an approval chain built from an export of exactly that kind. It carries the three things that make real HRIS data awkward: a row with no manager on it, a guard against a requester sitting inside their own approval chain, and an approver on leave with a delegate named on their row. Open the spreadsheet panel underneath and read the Line to column beside the canvas.
A reporting line as a route, not a tree
The approval chain from an HRIS export at four stages of completeness. Open the spreadsheet panel to see which columns are filled in.
Read the row, check for a manager
The first rows do nothing but read the file: "Raise a request against a cost centre", then "Read the requester's row from the HRIS export", then the diamond "Does the row name a manager?". Its No route goes to "Ask the People team to correct the reporting line", because a blank manager_id is a data problem before it is a routing problem. Only the Shape column is filled in at this stage, so the rows are still a list.
Walk manager_id up the file
"Walk manager_id up to build the approval chain" is the row that does the work, and the three diamonds after it are the checks that walk needs. "Is the requester inside their own approval chain?" catches the cycle, "Is the named approver available?" routes to a delegate, and "Within the line manager's approval limit?" decides whether one signature ends it. Line to now holds row numbers, so the arrows exist, but nothing yet says which exit is which.
Label the escalation branches
Line text pairs with Line to by position, so "Within limit,Over limit" sends the first number to a signature and the second to "Escalate to the department head". The same pair repeats at the department head and again at the director, which is the escalation ladder your approval-limit column already encodes. Row 18 closes it out with "Take it to the executive committee or withdraw it?".
Add the two lane columns
The Horizontal lane column carries the level in the reporting line (Employee, Line manager, Department head, Director, Executive committee), so depth in the org tree becomes distance across the canvas. The Vertical lane column carries the function: Requesting line, Finance, People team, Executive office. With both filled in you can read off that the People team appears only when the export was wrong, and Finance only when the spend sits on another line's cost centre.
How it works
Export the columns the routing depends on
You need employee_id, manager_id and a readable name for each person. Add job title, cost centre, approval limit and any delegate column, because those are what decide where a request stops climbing. Leave out everything the chart will never show (salary, address, start date), since a narrower file is far easier to check by eye, and an unrecognised column is carried through the paste and ignored anyway.
Read the file as text before a spreadsheet does
Open the export in a text editor first. Check that the delimiter is a comma and not a semicolon, that names containing a comma are wrapped in double quotes, that the file is UTF-8 so accented names survive, and that the first header really is employee_id rather than a byte-order mark followed by employee_id. Each of these fails quietly: columns are matched on header name, so a header that is not exactly what you think it is matches nothing.
Decide which of the two diagrams you are building
A box per person, arranged by who reports to whom, is a tree and belongs in the org-chart editor. A path a request travels through the reporting line is a flowchart and belongs here: one row per step rather than one row per person, with the export supplying the levels, the limits and the delegates. Decide this before you start numbering rows, because the two shapes do not convert into each other.
Invert manager_id into row numbers
Sort the rows into the order you want them numbered first, because Line to refers to positions and renumbering afterwards rewires everything. Then, for each person, collect the row numbers of everyone whose manager_id equals that person's employee_id and put them in that person's Line to, comma-separated. Reports become outgoing arrows; manager_id is only the lookup key and never gets pasted into Line to itself.
Resolve the orphans and the cycles in the file
Sort by manager_id and confirm every value appears as an employee_id somewhere in the same file. The ones that do not are orphans, usually because the export was scoped to one department or to active staff only. Then walk each chain upward and stop if you revisit a row: a pair of rows naming each other is a cycle, and it is either an acting arrangement nobody closed out or two rows edited on the same day by different people.
Paste it in, then add shapes and lanes
Drop the .csv onto the spreadsheet area of a new chart, or paste the CSV text into it. Set Shape to Decision on the rows that ask a question and Start, Success and Reject on the terminators, put the answers into Line text in the same order as the Line to numbers, and put the level of authority into the Horizontal lane column so each rung of the reporting line gets a lane of its own.
Mistakes to avoid
manager_id points up, Line to points down
The manager column names a parent; the Line to column names successors. Move one into the other unchanged and every arrow runs from a person to their boss. The tell is the top of the organisation: it ends up with arrows pointing into it from every direction and none coming out.
An employee_id is not a row number
Line to reads positions in the sheet (the numbers down the left of the editor), so a cell holding E1042 or 00147 connects nothing and raises no error. Do the join in the export, replacing identifiers with positions, before you paste. /guides/how-to-define-flowchart-connections-in-csv covers that column in detail.
Managers the export does not contain
A manager_id with no matching employee_id row is an orphan, and it almost never means the person has no manager. Department-scoped exports, active-only filters and a leaver whose replacement was never recorded all produce it. The blank at the very top of the organisation is the one legitimate case.
The spreadsheet quietly rewrote the identifiers
Employee numbers with leading zeros are the classic casualty: open the CSV in a spreadsheet and 00147 becomes 147, so half the manager_id joins stop matching and you get a forest of one-person trees. Work from the raw text, or import the ID columns as text, and compare the row count of your join against the row count of the file.
Editable organizational charts
Open the reporting-line example
Open the example as your own chart to see the columns filled in, then paste your own export over the rows once employee_id and manager_id are resolved to row numbers.
Related guides
Frequently asked questions
Can QueryChart import an org chart CSV directly?
You get the rows in by dropping the .csv onto the spreadsheet area or pasting the CSV text into it, and columns are matched by header name rather than by position, so the order they sit in does not matter and anything unrecognised is carried through and ignored. What it will not do is infer a hierarchy for you: there is no import wizard, no column-mapping screen and no connector to an HR system. The file has to already say, in the Line to column, which row numbers each row connects to.
Should I use the flowchart editor or the org-chart editor?
If the output is a headcount tree (a box per person, managers above reports, read to answer who reports to whom), use the dedicated org-chart editor, which is built for that shape and keeps a single parent per person. Use the flowchart editor when the reporting line is a route rather than a picture: an approval that climbs until it meets someone with a high enough limit, an escalation path, a request that has to detour through Finance. Those have decisions and exceptions in them, and a decision is not something a tree can draw.
What happens if two people report to each other?
The chart will draw it (a pair of arrows pointing at each other), but anything that walks the chain to the top will not terminate, which is why you check for cycles in the file rather than after the paste. In practice a cycle is an acting arrangement nobody closed out, or two rows edited on the same day by different people. The example chart guards against the routing version of the same problem with the decision "Is the requester inside their own approval chain?", which skips a level instead of looping.
My export is semicolon-delimited and some names contain commas.
Both are normal for HRIS exports and both are fixable in the file. A semicolon-delimited export (common when the system was configured for a European locale) should be re-exported or converted to commas; paste it as it stands and the whole header row lands in a single column, which at least fails obviously rather than subtly. A value containing a comma is legal as long as it is wrapped in double quotes, so "Nakamura, Yuki" stays one field while the same text unquoted becomes two.
How do I keep the chart current when the HRIS changes?
By re-exporting and re-pasting, not by connecting the two: there is no live link between QueryChart and an HR system. That matters less than it sounds, because what you drew is the routing rule rather than the roster: "escalate to the department head when the amount is over the line manager's limit" survives a reorganisation that changes every name in the file. Redo the export when the levels or the limits change and leave it alone when only the people do. /csv-to-flowchart has the short version of the whole conversion.