Sankey Chart With Too Many Nodes: How to Simplify It
A Sankey with dozens of nodes turns into a tangle. Group small categories, split one chart into two, and keep the nodes that carry the story; the example shows how.
When a Sankey has too many nodes, the thin ribbons cross each other and nobody can follow them. The fix is to decide what the chart is about and drop, group or move everything else.
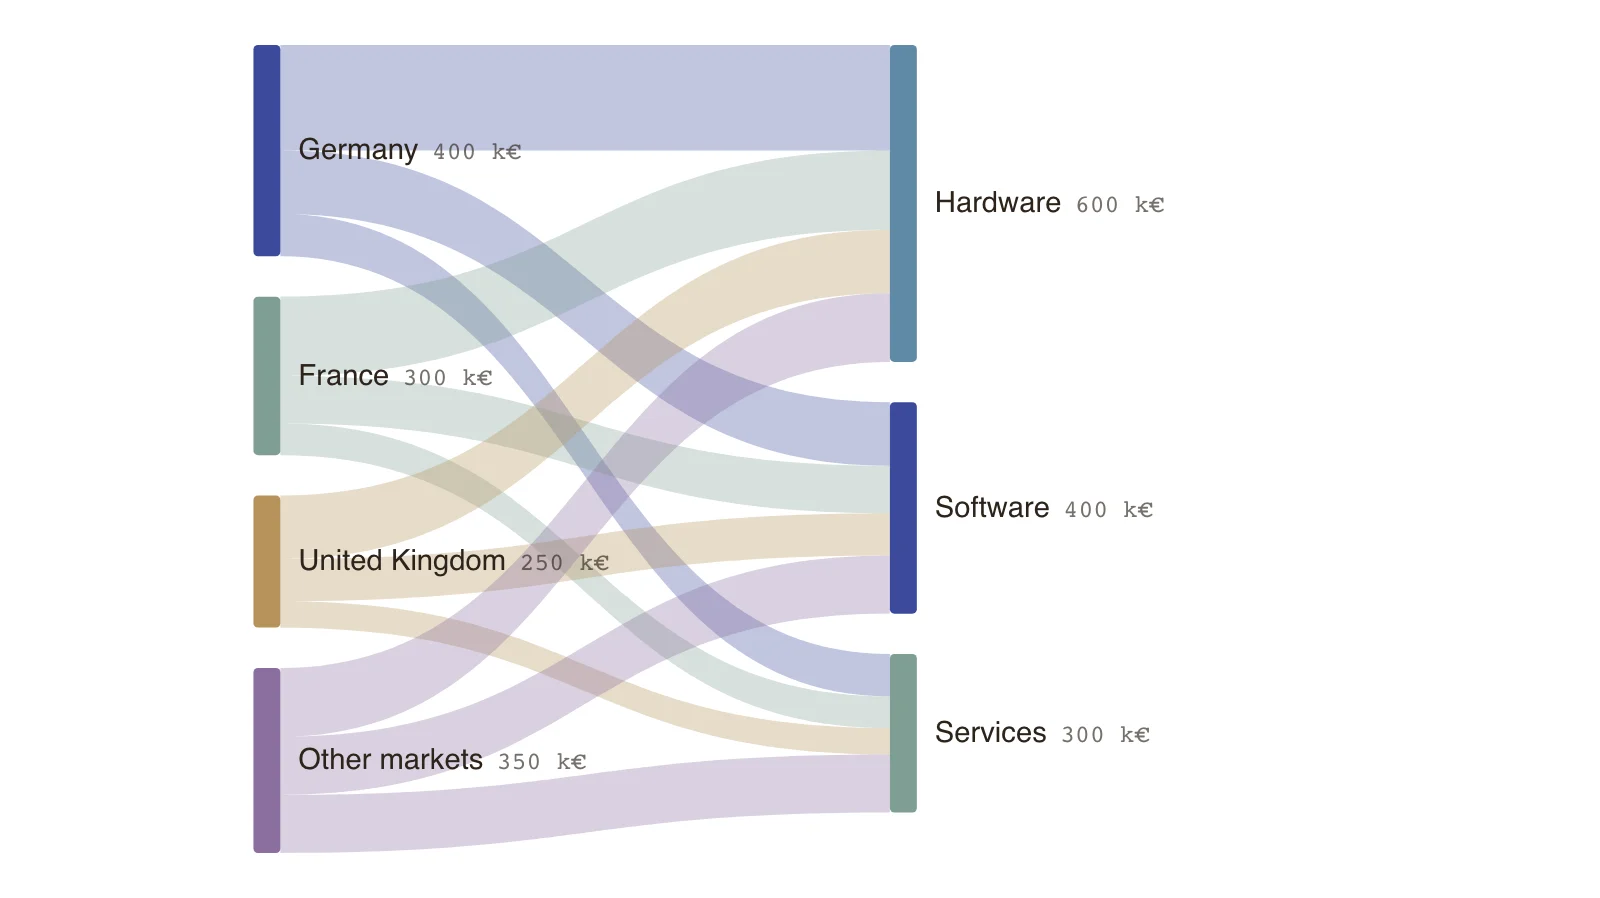
The example is the result of such a clean-up: instead of one node for every country, four markets feed three product lines. The small countries were grouped into Other markets, which made the chart readable without losing the total.
A useful test is whether you could explain the chart in a sentence. If not, it is probably two charts.
Group the long tail
Keep the three to eight largest nodes in a column and add an Other node for the rest. The total is preserved, and the reader still sees the pattern.
Split into two charts
If the story has two parts, such as who buys and what they cost, draw two charts. A chart that answers two questions usually answers neither.
Cut stages that add nothing
A stage that every flow passes through in the same proportion carries no information. Remove it.
Keep the detail in a table
Put the full list in the sheet or in an appendix. The chart is for the pattern, the table is for the detail.
Key points
- 1,300 k€ of revenue across four markets and three product lines.
- Hardware is the largest line at 600 k€ (46%).
- Other markets account for 350 k€, more than the United Kingdom, which is why they deserve a node.
- The figures are invented.
The example’s data
Invented figures, balanced at every node.
| From | To | Amount (k€) |
|---|---|---|
| Germany | Hardware | 200 |
| Germany | Software | 120 |
| Germany | Services | 80 |
| France | Hardware | 150 |
| France | Software | 90 |
| France | Services | 60 |
| United Kingdom | Hardware | 120 |
| United Kingdom | Software | 80 |
| United Kingdom | Services | 50 |
| Other markets | Hardware | 130 |
| Other markets | Software | 110 |
| Other markets | Services | 110 |
The same data as CSV
source,target,value
Germany,Hardware,200
Germany,Software,120
Germany,Services,80
France,Hardware,150
France,Software,90
France,Services,60
United Kingdom,Hardware,120
United Kingdom,Software,80
United Kingdom,Services,50
Other markets,Hardware,130
Other markets,Software,110
Other markets,Services,110
How it works
Rank nodes by total value
Sort each column by the total flowing through it.
Group the small ones
Merge everything below your cut-off into Other.
Test the story
Check you can state the main finding of the chart in a sentence.
Move detail to a table
Keep the full list available outside the chart.
Frequently asked questions
How many nodes is too many?
There is no fixed number. Beyond about fifteen to twenty nodes, or more than six per column, most Sankeys become hard to follow.
Will grouping hide something important?
It can. Check the Other node: if it is larger than some named nodes, name its biggest member separately.
Edit this example
Open the example as your own chart and group your own categories.